Opioid abuse statistics highlight the severity of the opioid crisis in the US.
Opioid Abuse Statistics
Substance use disorder
- Alcohol abuse statistics
- Amphetamine abuse statistics
- Cannabis abuse statistics
- Cocaine abuse statistics
- Heroin abuse statistics
- Illicit drug abuse statistics
- Inhalant abuse statistics
- Methamphetamine abuse statistics
- Opioid abuse statistics
- Prescription Drug abuse statistics
- Tobacco abuse statistics
Opioid abuse statistics | Table of Contents
Opioid Abuse
Opioids, also referred to as narcotics, include powerful prescription medications, such as tramadol, oxycodone, hydrocodone, and fentanyl, as well as illicit drugs like heroin. A few of the long-term risks of opioid drug abuse include addiction, overdose, physical and psychological health complications.
Opioid abuse, addiction, and overdose are major public health concerns in the United States. The statistics provided below highlight the severity of the opioid epidemic in the US.
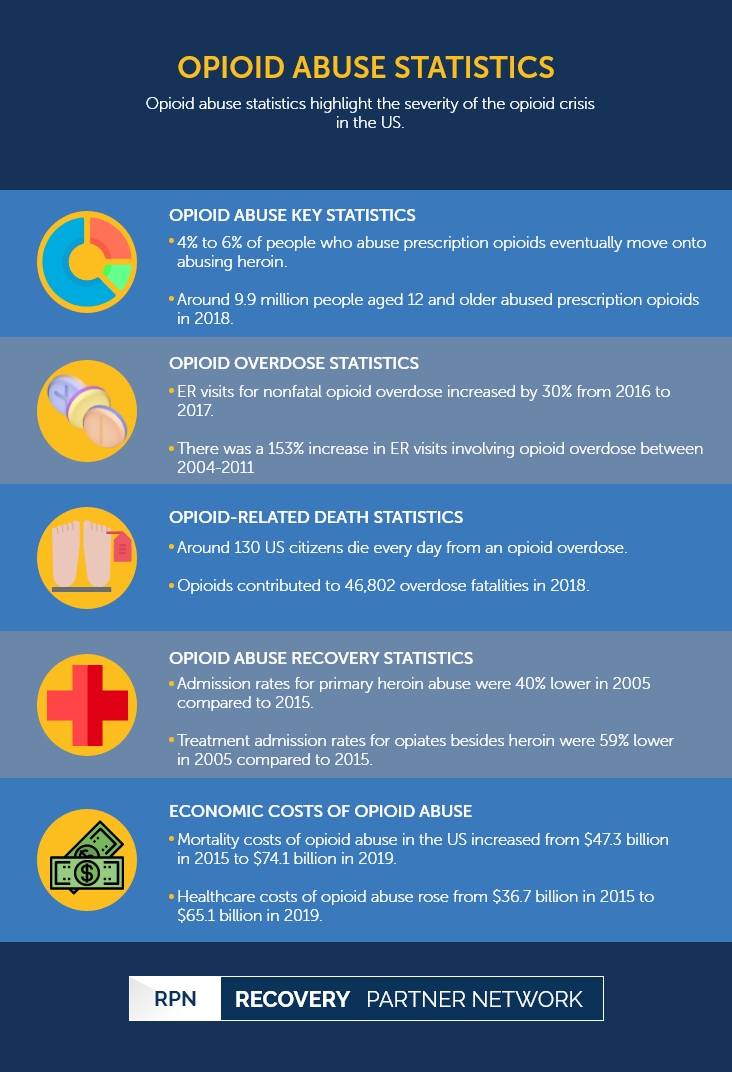
Opioid Abuse Key Statistics
- According to the National Institute on Drug Abuse (NIDA), about 21 to 29 percent of those prescribed opioids for severe pain have misused them.
- According to a study in 2012, the average age of the first abuse of prescription opioids was 22 years.
- It is reported that 4 to 6 percent of people who abuse prescription opioids eventually move onto abusing heroin. About 80 percent of patients who use heroin for the first time have abused prescribed narcotics.
- The proportion of babies born with neonatal abstinence syndrome or neonatal opioid withdrawal syndrome (NAS/NOWS) has increased more than five times from 2004 to 2014.
- CDC estimations also show that over 191 million opioid prescriptions were administered to US patients in 2017—with large variation across states.
- According to the National Survey on Drug Use and Health, around 9.9 million people aged 12 and older abused prescription opioids in 2018.
- In 2010, around 12 million individuals used prescription pain medication for non-medical purposes.
- Around 17.1 percent of substance abusers began by abusing pain medications.
- 5.2 million Americans used prescription opioids non-medically in the past month.
- Kentucky had the highest rate of opioid abuse and addiction between 2015 and 2016, with the rate of 16.9 out of every 1,000 Americans.
Opioid Overdose Statistics
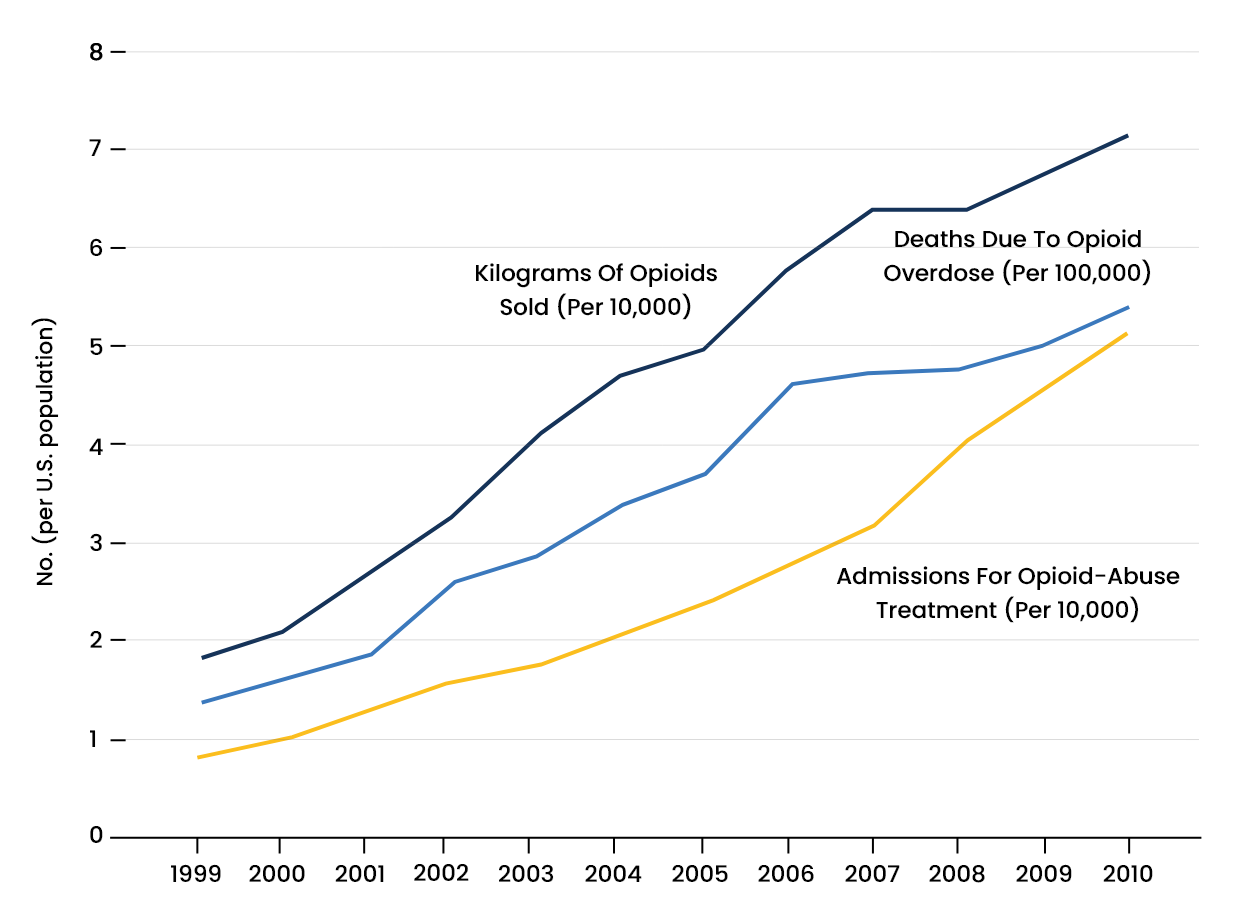
The number of opioid overdoses has risen dramatically over the last two decades. This is due to the growing usage of opioids in chronic pain management (the origin of the opioid crisis in the US) and the expanded use of highly potent opioids on the illicit drug market.
- Around 3 out of 4 prescription drug overdoses are caused by prescription opioids.
- According to the Centers for Disease Control and Prevention (CDC), from 2016 to 2017, emergency room visits for nonfatal opioid overdose increased by 30 percent.
- There was a 70 percent increase in opioid overdoses in the Midwestern region between 2016 to 2017.
- Large cities experienced a 54 percent increase in sixteen states.
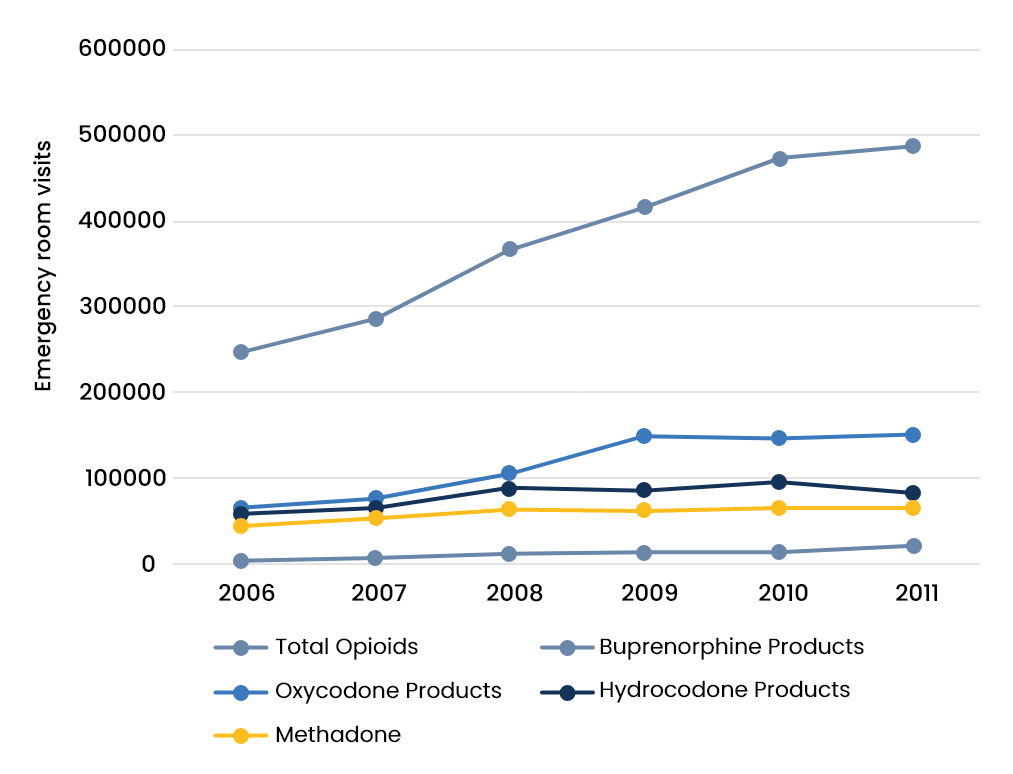
- According to the Drug Abuse Warning Network, there was a 153 percent increase in the number of ER visits involving opioid overdose between 2004 and 2011.
- There was a significant increase in ER visits from 4,440 in 2006 to 15,778 in 2010 related to non-medical use of opioids.
- There was a significant increase in nonfatal opioid overdose emergency room visits from 2018 to 2020 from 3.89 percent to 7.77 percent.
- Cases of opioid overdose increased by 30 percent in men and 24 percent in women between 2016 to 2017.
- A total of 967,615 nonfatal drug overdoses were treated in emergency rooms in 2017.
Opioid-Related Death Statistics
The increase in overdose rates has resulted in a rise in opioid overdose fatalities over the last ten years. In recent years, the increase of opioid-related overdose deaths is attributed to synthetic opioids, particularly fentanyl and illicit analogs. According to Our World in Data, between 1999 and 2017, 426,218 Americans lost their lives to opioids.
- According to a study conducted by NIDA, there are over 2.5 million people in the US suffering from opioid use disorder, which led to more than 28,000 overdose deaths in 2014.
- Overdose fatalities involving opioids, including prescribed opioids, heroin, and synthetic opioids (like fentanyl), have risen nearly six-fold since 1999.
- Around 130 US citizens die every day from an overdose of opioids.
- Opioids contributed to 46,802 overdose fatalities in 2018 (69.5 percent of all drug overdose deaths). Two out of three (67 percent) opioid-involved overdose fatalities were caused by synthetic opioids.
- Drug overdoses were the primary cause of death in adults under 50 years of age in the US in 2017.
According to a report published by the Centers for Disease Control and Prevention (CDC), around 450,000 people died from an opioid overdose, including prescription and illicit opioids, between 1999 to 2018.
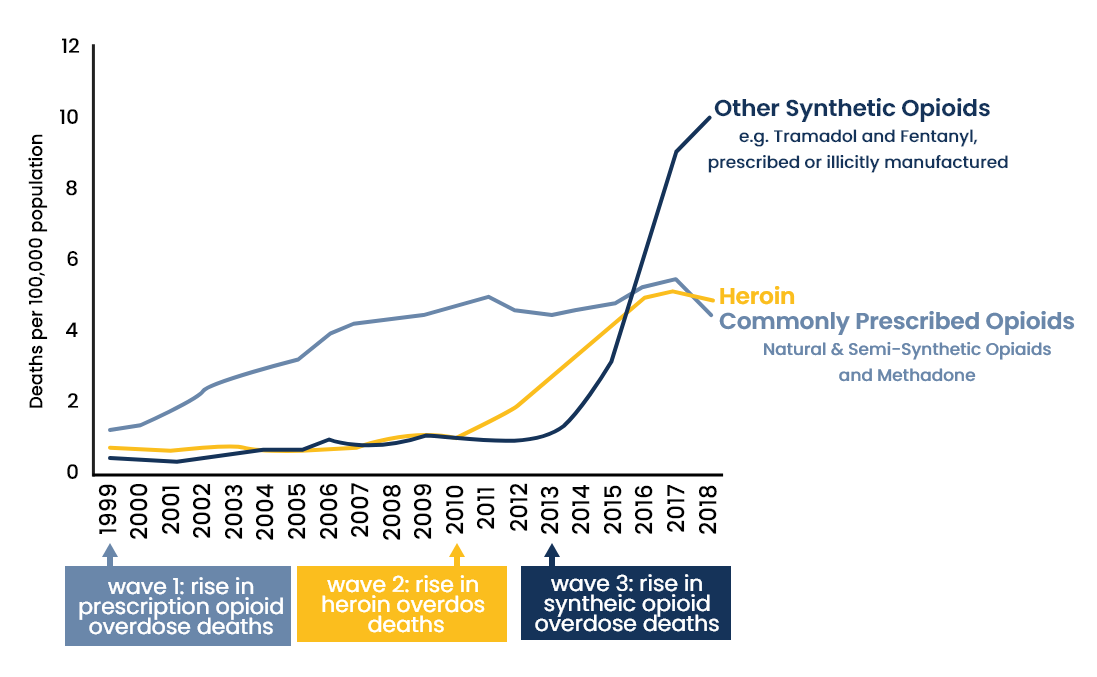
- The significant rise in fatal opioid overdose between 1999 to 2018 came in three distinctive waves. The first wave began in the 1990s with the increase of opioid prescriptions.
- The second wave began in 2010 due to an increase in heroin abuse.
- The third wave began in 2013 with the introduction of synthetic opioids, such as fentanyl.
Opioid Abuse Recovery Statistics
Significant patterns and changes have been recorded in opioid abuse treatment admissions and recovery rates. Owing to the advancements made in addiction treatment over the past decade, the use of medications, such as buprenorphine, methadone, and extended-release naltrexone, have significantly increased the rate of recovery from opioid use disorder.
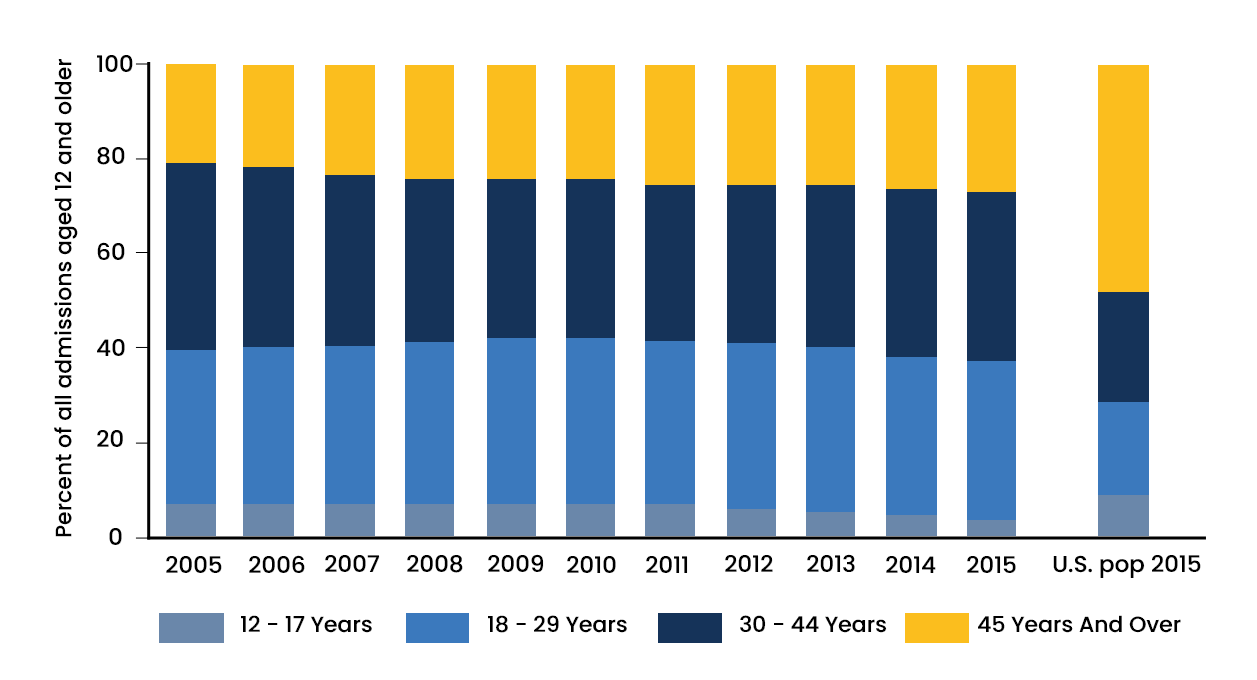
According to the SAMHSA Treatment Episode Data Set (TEDS) 2005-2015:
- The rate of admission for primary heroin abuse was 40 percent lower in 2005 at 104 per 100,000 population aged 12 or older in comparison to 146 per 100,000 in 2015.
- The rate of treatment admission for opiates besides heroin was 59 percent lower in 2005 at 29 per 100,000 population aged 12 years or older than that of 45 per 100,000 population in 2015.
Economic Costs of Opioid Abuse
The economic cost of opioid abuse is calculated through healthcare spending, criminal justice costs, lost productivity due to addiction and incarceration, and fatality. This cost has significantly increased since 1999 due to the rise in opioid abuse.
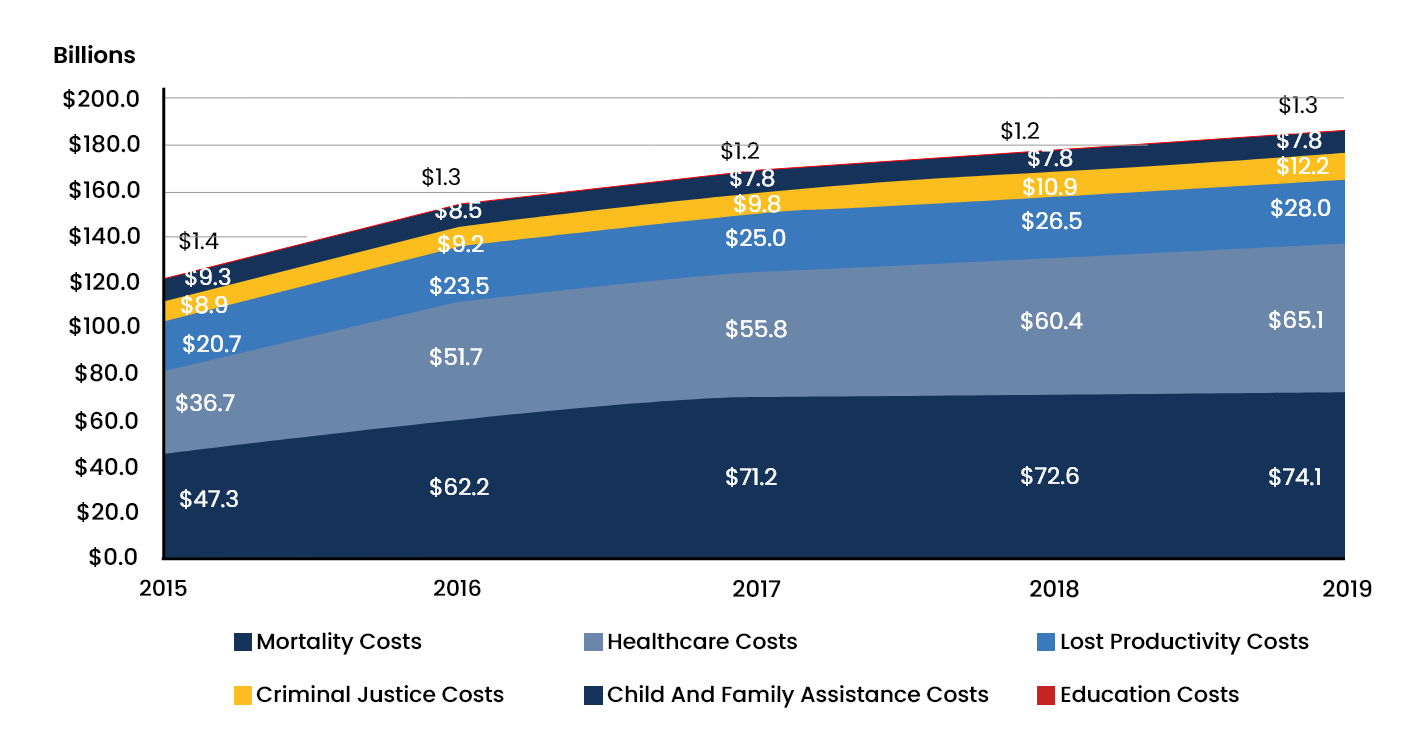
According to the study conducted by the Society of Actuaries, the economic Impact of non-medical opioid use in the United States are:
- Healthcare costs of opioid abuse in the US increased from $36.7 billion in 2015 to $65.1 billion in 2019.
- Mortality costs of opioid abuse in the US increased from $47.3 billion in 2015 to $74.1 billion in 2019.
- Criminal justice costs of opioid abuse in the US increased from $8.9 billion in 2015 to $12.2 billion in 2019.
- Child and family assistance costs of opioid abuse in the US decreased from $9.3 billion in 2015 to $7.8 billion in 2019.
- Education costs of opioid abuse in the US remained stable, with $1.4 billion in 2015 to $1.3 billion in 2019.
- Lost productivity costs of opioid abuse in the US increased from $20.7 billion in 2015 to $28 billion in 2019.
Recovery Partner Network
We aim to educate and empower. If you feel our library of resources does not cover your specific need, reach out to us, and we would be happy to help.
STATISTICS
© Copyright 2026